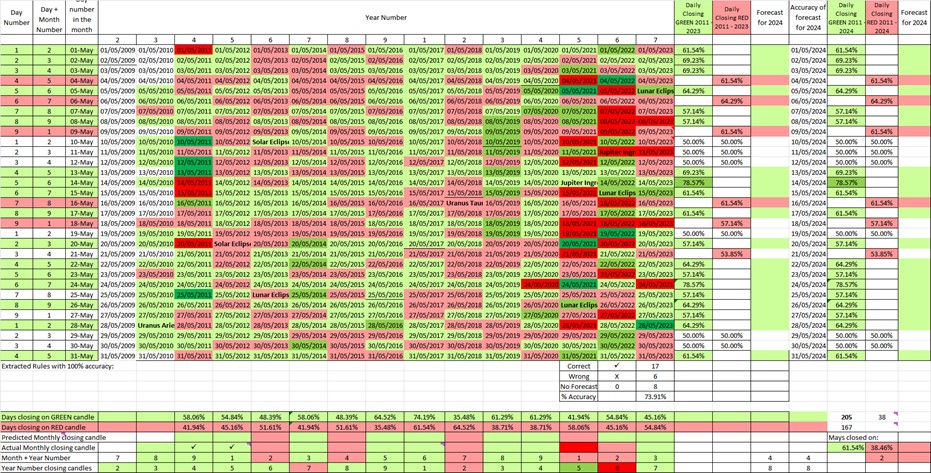
Green closing candles and red closing candles on daily TFs are counted and percentages obtained. Those ratios are monitored since 2011 and the accuracy of the previous forecast is offered so that you know where you stand with this forecast for the current year.
This is 84% purely statistical forecast based on the historical performance of Bitcoin on daily timeframes as 26/31 days are forecasting themselves. I have only counted the percentages of green closing candles and red closing candles on each date through all the years.
The purely statistical forecast does not give good total accuracy of predicting the daily closures of the next year. That is why I am intervening on 5/31 dates of the month and inputting my bespoke forecasts on those 5 dates. My involvement in the forecast is 16% (5/31). On the right of the forecast there is a white table which contains info on which dates I am using bespoke involvement in making the forecast. There are some numbers written there. In that way you and I can also measure whether my involvement is increasing the accuracy of the forecast or not.
For now, treat this forecast as experimental and use it only as a confluence to your system rather than as a main source of decision-making.
The value of the statistical forecast is that it extracts those dates in the month that have been closing consistently through the years on the same colour candles >69% of the time and it sifts out dates in the month that are performing according to chance. In May, those days are only 5. Another value of the statistical forecast is that it allows for trends to be monitored. It answers questions such as: do more dates close on green candles or more dates close on red candles through the years and through the different weeks of the month and does the number of daily closing candles of the same colour determines the monthly closing candle. There are some other fun metrics in the spreadsheet which highlight patterns and trends.
If only 5/31 daily candles have been closing on the same colour with >69% occurrences, that means that the rest of the days are performing to chance and therefore they cannot be trusted that they will close on a certain colour. Having that awareness makes them non-tradable days for as long as we do not have more significant historical data about them.
You will receive your file within two working days. The file you receive will be the most up-to-date forecast which may look different to the one that is on the product photo. The photo is used only to show what the forecast looks like.
Be the first to review “Bitcoin May Daily Timeframes Forecast” Cancel reply
You must be logged in to post a review.


Reviews
There are no reviews yet.