Bitcoin February Daily Timeframes Forecasting Tool Using Historical Performance (in Excel)
£111.00
Bitcoin February daily timeframes forecast
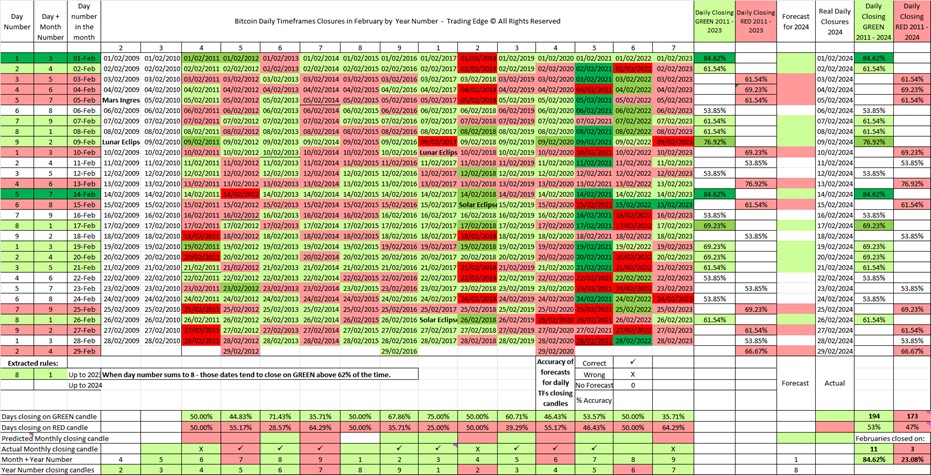
Bitcoin Daily Timeframes closures in February since 2011 are counted and percentages of green and red candles are presented year by year since 2023. A forecast is then made for the following year on the basis of those historical closures and the forecast is measured for accuracy. The stable days that tend to close on the same colour candles through the years are extracted and the fluid days that close on different colour candles are also extracted. We view those two types of dates as two different groups, rather that green against red.
This spreadsheet monitors whether the stable and the fluid days remain in their groups and just vary their percentage, or whether some days move from being stable green or red to being fluid. We are interested to know what the most stable days are and in that way we narrow our forecasts only to those days. Thus forecasting a smaller number of days with a higher percentage stable performance, allows our forecasts to increase in accuracy. In 2023 we forecasted the performance of 25 days in February and we obtained 48% accuracy. In 2024, we will remove the fluid days from our forecast and will measure the accuracy again.
This forecasts asks the question: if we ignore any significance in any external events, whether they are macro economy or astrological or astronomical, is there any kind of an intrinsic pattern that Bitcoin performance follows that produces prominent days in the month that have a clearly defined tendency to close on green or on red, with a high percentage of occurrences. And so far it appears that there are. 6 dates in February close on green candles >69% of the time and 4 dates in February close on red candles >69% of the time. If we can predict the daily timeframes closures for 1/3 of the month reliably through the years, that is quite something.
The purpose of this forecast is to extract significant dates without taking any astrological and astronomical events into account, is so that this forecast can serve as an independent confluence to the astrological/astronomical forecasts done by ourselves and by our peers and to all other forecasts.
This statistical forecast should never be used alone to forecast Bitcoin’s performance on a future date as the stable dates in February are only 10 in total therefore 2/3 of the month performs according to chance.
This forecast was designed to serve as a neutral cooler to a trader’s bias, by simply presenting the historical occurrences of green and red candle and by acting as an independent source of confluence. This forecast was not designed to be used as a trading signal and we recommend you to use it only as an additional confluence.
The picture you are seeing is not the complete product. There are several numerological rules that are extracted for daily timeframes and for monthly timeframes and some more interesting statistics.
You will receive your file within 2 working days by email. You will receive the most updated version of the forecast which may not be exactly the same as on the picture.
Be the first to review “Bitcoin February Daily Timeframes Forecasting Tool Using Historical Performance (in Excel)” Cancel reply
You must be logged in to post a review.


Reviews
There are no reviews yet.