
Bitcoin Pivots
Bitcoin Pivot High in March 2025
So far the shape of March is: bottom in Week 1, top in Week 3-4. Retracement in Week 4. Double bottom 24 – 31 March. That’s without the Venus Rx backtesting. I discussed in the March 2025 blog that Venus Rx brought the double bottom earlier in the month in 2017.
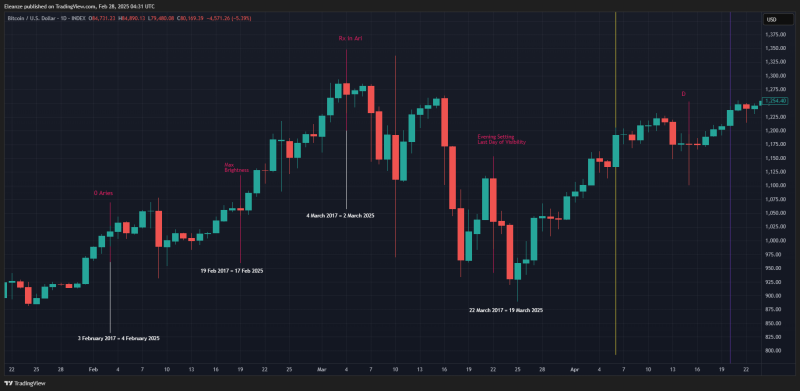
The date of the Pivot high in March depends on the date of the bottom. The later the bottom, the later the top. The earlier the bottom, the earlier the top. As you can see in the chart, the seasonal fractals are showing 26 March as a pivot high. If the seasonal fractals are valid with their forecast for the 2-5 March bottom, then we can take them seriously for their forecast for 26 March top for March. If they continue to be invalid as in the last 2 days, then we can trust them less.
Evidence for a Top earlier in Week 3 of March.
Starting with the strongest probabilities:
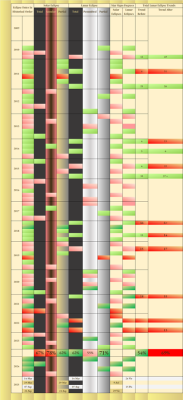
1. 14 March Total Lunar Eclipse back-testing delivered significant results: 62% of Total Lunar Eclipses have closed on GREEN, i.e. our 14 March expectation on a daily TF.
The trends before the Total Lunar Eclipses have been UP 54% of the time.
The trends after the Total Lunar Eclipses have been DOWN 69% of the time. It doesn’t matter from which daily TF the trend reverses down, the Total Lunar Eclipse has been a Top 69% of the time.
The numbers you see are number of days. Green box = days UP. Red box = days DOWN. I have them to monitor what year we are most similar to. Don’t use them to forecast anything.
Conclusion: Total Lunar Eclipse is confluence 1 for a 14 March TOP and a DOWN trend after.
This table is extracted from my Eclipse Trading Strategy. The full table + a lot more is given in the Eclipse package. If you have ever wondered what the Eclipses do for Bitcoin EXACTLY with all backtesting historical data given, the Eclipse Trading Strategy will finally answer your questions and save you tons of time.
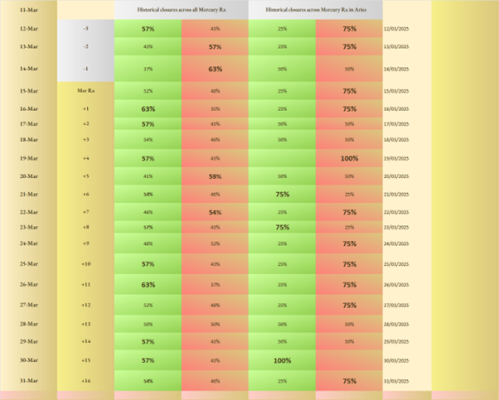
2. Mercury Rx in Aries beginning on 15 March 2025 is a confluence for a DOWN trend after as early as 12 March 2025. These are the daily TFs historical closures of this event.
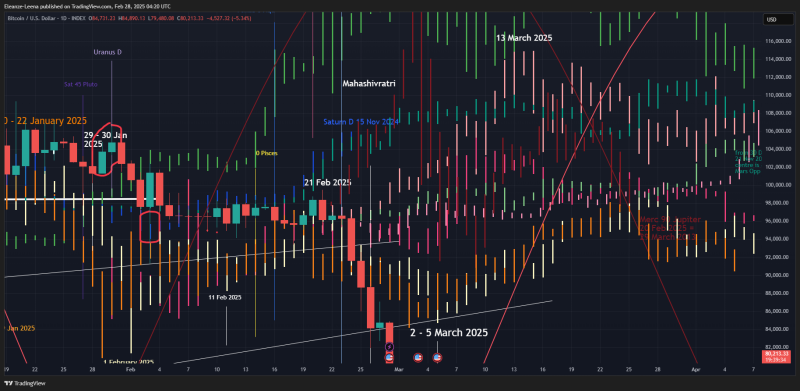
3. Juno is Sag is forecasting a top on 13 March. The high pink fractal.
4. I have some confluences for 17 March as a pivot high in March 2025
That is the Mercury declination graph posted in Update 6 to all subscribers.
Conclusion: most of the evidence shows a top between 13 March – 17 March. Narrower than that would be 14 – 17 March. 14, 15, 17 March are all highly confluenced however 17 March stands out to me as Mercury tends to pump in the first couple of days when it goes retrograde and changing declination on 17 March makes it a possible top.
The 26 March top is less likely because it doesn’t account for Venus Rx and Mercury Rx, but it is useful to know what the price would be doing if those 2 x bear cycles are weak. Everything is possible. We have a lot of bull events in March. All of those fractals that you see going up, they are all bull cycles operating at present.