
Bitcoin Pivots
Bitcoin March 2025
Currently Bitcoin is moving along this dark green fractal which I am posting for the first time because Bitcoin jumped on this fractal only since 21 February. According to this fractal Bitcoin will be making a bottom on Friday 28 February. Then the White fractal is bottoming on 1 March. The 2 x seasonal fractals that you know (white and orange) are not on this chart. You can see them below in this email. Their bottoms are on 2 March and 5 March.
The dark green fractal tops on 13 March and makes a double bottom on 25 March. The white fractal tops on 18 March. The higher red-orange fractal tops on 15 March and makes a double bottom on 24 March.
The month of March 2025 has a bell shape like many months before. Bottom in the beginning of the month, a pivot high in the middle and a double bottom in the last week of March around 24 -25 March according to these fractals. The double bottom is a HL and from there on price goes UP. We don’t have a bottom yet. If that LL on 26 February remains the bottom = that means further down moves. I explain below in this email.
We want a proper bottom on 28 February – 1 – 9 March at the latest to finally close this chapter of yearly bottoms. We’ll see what we get tomorrow 28 March.
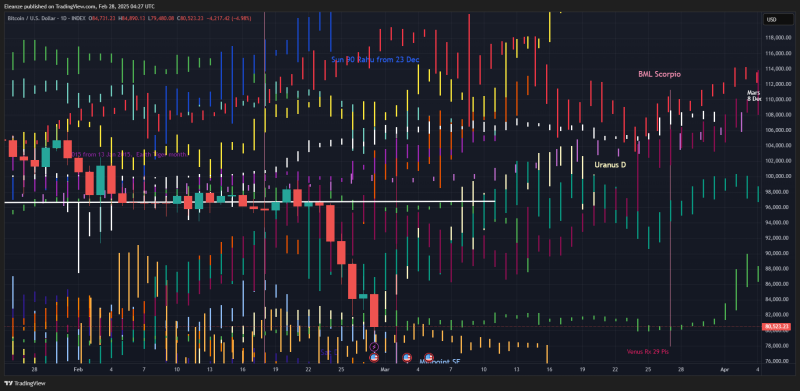
So that was the forecast made by 3 x seasonal fractals, Uranus Direct and Venus synodic cycle. All seasonal fractals are closing March on a green. The seasonal fractals so far have dominated the price action. Therefore they are reasonably trustworthy. However we can’t ignore that this season there are 2 x bear events: Mercury Rx in Aries from 15 March 2025. The backtesting of that is down below in this email. It projects dumping for most of the 2nd half of March. Which is fine because the seasonal fractals are suggesting that as well. So Mercury Rx confirms the 2nd half of March forecast as given above, in terms of a down trend, but not in terms of a double bottom date and whether the double bottom will be a LL or HL. But at least the direction is the same. Whereas Venus turning Retrograde in Aries on 2 March 2025 is giving us completely the opposite forecast to the seasonal fractals for the first half of March.
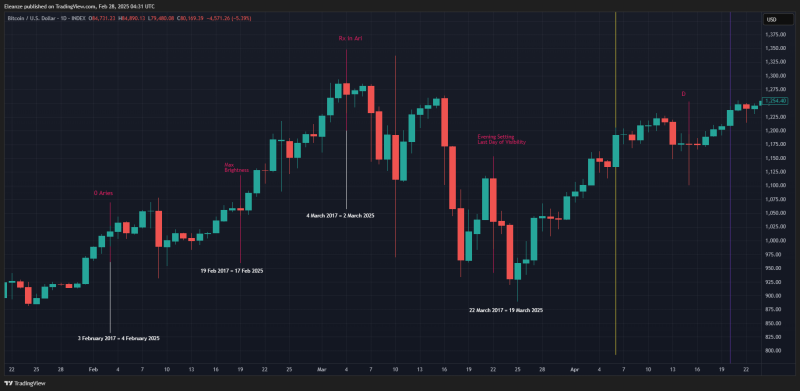
Venus has been Retrograde in Aries only once before in Bitcoin’s life. That was in 2017. This is what happened then: When Venus turned Rx on 4 March 2017, that kicked off a bear reversal which bottomed on 22 March 2017 and from there on the price went up. How much can we trust this fractal? We check if the price action before Venus goes Rx matches the price action of 2025. And it doesn’t. In 2025 Bitcoin reached a local top on 21 February and made a bear reversal. Nothing like that in 2017. Therefore if it hasn’t been accurate so far, we don’t have a strong reason to expect it to be accurate from the day of Venus going Rx, but we can’t ignore it and pretend we don’t have this risk of dumping from 2 March. Also dumping on 2 March and bottoming on 5 – 10 March is what the seasonal fractals are forecasting, so it looks like Venus Rx is going to facilitate that dump from 2 March to the seasonal bottom on 5 – 6 – 9 March at the latest, which is a Yearly bottom by the way.
We can see on this fractal that the double bottom is earlier than the double bottom 24 – 25 March given above by the seasonal fractals. This double bottom date is 19 March 2025. This is not in alignment with Mercury going Rx from 15 March which is expecting to be dumping longer than 19 March. Mercury Rx starts closing daily TFs on green from 21 March at the earliest.
To consolidate all of the above forecasts in one statement: Bitcoin is expected to make a local bull reversal between now and 2 March, make a local top on 2 March, dump between 2 March till 5-6 March and then head up to make a double top on 13 – 15 March. Bear reversal from 13 – 15 March till 18 March and then either heading up towards the seasonal top on 19 – 22 March or heading down towards a double bottom on 24 – 25 March. And head up from there on.
The above statement is made on the assumption that all of the above forecasts are accurate. However if one of those fractals becomes invalidated, then some of the local pivots may be missing.
That is why it is important to keep both pictures in our minds: the detailed picture with all pivots mentioned and the bigger picture listing the key pivots: Week 1 bottom, 13 – 15 March top, Week 4 double bottom.
In both statements, the month closes on a red.
If you don’t have time to read the rest of the email, the above information is sufficient to keep you going in March 2025.